| The World Bank Group.
Global Development Finance 1998 Chapter
3
The changing role of official finance
Back to Contents
This chapter covers trends in net official finance and aid
allocation, efforts to help heavily indebted poor countries achieve sustainable levels of
external debt, and the increasing volume and scope of guarantee activities.
Shifting focus of
aid
The events of the past two decades have greatly changed the
political context of official finance to developing countries. The collapse of centrally
planned economies in Eastern Europe and the poor performance of heavily distorted
economies in Africa, Latin America, and the Middle East have underlined the importance of
providing appropriate incentives for private sector growth. And the need to contain
government spending in industrial countries, the end of the cold war, and the evidence of
mismanagement of aid flows to some countries have reduced public support for official
development assistance. This section shows that:
- The decline in net concessional flows to developing countries
in real and nominal terms during the 1990s (including 1997) has been accompanied by
efforts to improve the effectiveness of aid by allocating a greater share to countries
with better policies. Continued improvements in aid effectiveness will be critical to
ensure benefits for developing economies and will provide the most convincing argument for
maintaining or increasing concessional assistance in the face of further planned cutbacks
by major donors.
Net official finance in 1996–97
Net official development finance, consisting of loans and grants
from government agencies and multilateral institutions, has declined in real (and even
nominal) terms since the early 1990s. This decline reflects constraints on the
availability of concessional resources, the decision by many governments to reduce direct
lending as private flows to developing countries have increased, and a shift by some
developing countries away from official sources to international capital markets. Net
flows also have been reduced by a sharp increase in amortization payments by middle-income
countries as the debt deferred by Paris Club creditors during the 1980s has come due.
The decline in net nonconcessional flows was interrupted in 1997
by the international rescue package for Thailand. The package, which included $9 billion
of nonconcessional finance, boosted net nonconcessional flows to an estimated $6.9 billion
for the year, compared with –$5.5 billion in 1996 (table 3.1). Excluding the Thai
package and the early repayment by Mexico of the remaining amounts due under its 1995
rescue package, official nonconcessional flows are estimated at $5.5 billion in 1997,
compared with an average of $11.4 billion a year in 1990–92. Net nonconcessional
lending by multilateral institutions (excluding the IMF) continued its upward trend over
the past few years, a result of strong increases in net flows from the Inter-American
Development Bank and the World Bank.
Back to top
Back to Contents
Table 3.1 Net official flows of
development finance, 1990–97
(billions of U.S. dollars)
| Category |
1990 |
1991 |
1992 |
1993 |
1994 |
1995 |
1996 |
1997a |
| Official development finance |
56.4 |
62.7 |
53.8 |
53.6 |
45.5 |
54.0 |
34.7 |
44.2 |
| Concessional finance |
43.9 |
50.7 |
44.1 |
41.7 |
46.3 |
45.4 |
40.1 |
37.3 |
| Grants |
29.2 |
35.1 |
30.5 |
28.4 |
32.7 |
30.6 |
29.2 |
25.1 |
| Loans |
14.7 |
15.6 |
13.6 |
13.3 |
13.7 |
12.8 |
10.9 |
12.3 |
| Bilateral |
8.7 |
9.3 |
7.1 |
6.8 |
5.9 |
5.5 |
2.8 |
4.6 |
| Multilateral |
6.0 |
6.4 |
6.5 |
6.5 |
7.8 |
7.2 |
8.1 |
7.7 |
| Nonconcessional finance |
12.5 |
12.0 |
9.7 |
11.8 |
–0.8 |
8.6 |
–5.5 |
6.9 |
| Bilateral |
2.9 |
4.0 |
4.0 |
3.2 |
–3.4 |
4.5 |
–10.0 |
–2.8 |
| Multilateral |
9.6 |
8.0 |
5.7 |
8.7 |
2.6 |
4.1 |
4.5 |
9.7 |
| Memo items |
|
|
|
|
|
|
|
|
| Use of IMF credit |
0.1 |
3.2 |
1.2 |
1.6 |
1.6 |
16.8 |
1.0 |
3.3 |
| Technical cooperation grants |
14.2 |
15.8 |
17.9 |
18.6 |
17.4 |
20.6 |
19.2 |
18.3 |
Note: Official concessional finance comprises inflows of official development
assistance (excluding technical cooperation grants) and official aid to Eastern Europe and
the former Soviet Union. Memo items are not included in preceding aggregates.
a. Preliminary.
Source: World Bank Debtor Reporting System and staff estimates.
Net concessional assistance to developing countries continued its
downward trend in 1997. The availability of concessional resources has been constrained by
the pressing need for fiscal consolidation in most industrial countries, the declining
strategic and military importance of development aid since the end of the cold war, and
weak public support for aid in some major donor countries, due in part to skepticism about
its effectiveness. Net inflows of official concessional finance, consisting of official
development assistance (ODA) and other official aid to low- and middle-income countries,
fell by an estimated $2.8 billion in 1997 (following a $5.3 billion decrease in 1996).
Dollar appreciation of roughly 10 percent in 1997 explains almost half this decline.1
The decline in development assistance since the 1980s has not
been accompanied by any decline in the need for aid. The number of people in low-income
countries increased from 2.4 billion in 1980 to 3.2 billion in 1995 (World Bank 1997d).
One study showed that the number of people living on less than $1 a day in developing
countries rose from 1.2 billion in 1987 to 1.3 billion in 1993 (World Bank 1996). And
while life expectancy has climbed in developing countries (from 56 years to 63 for males
and from 59 years to 66 for females between 1980 and 1995), access to education and health
services has worsened. The number of people 15 and older in developing countries who are
illiterate rose from an estimated 848 million in 1980 to 872 million in 1995, and the
number of people per hospital bed rose from 921 in 1980 to 950 in 1993 (World Bank 1997d).
Back to top
Back to Contents
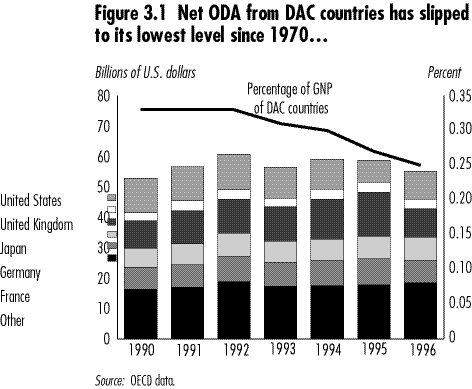
The detailed information now available for 1996 confirms the
decline in ODA flows. Net ODA flows (including technical cooperation grants) from the
OECD’s Development Assistance Committee (DAC) countries fell to 0.25 percent of their
GNP in 1996 (figure 3.1), the lowest level recorded since the United Nations adopted a
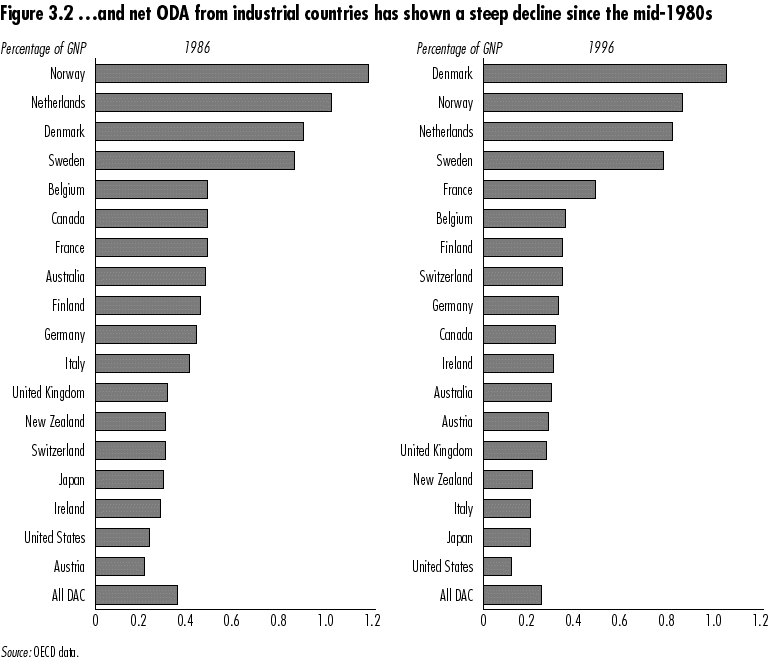
target of 0.7 percent of GNP in 1970. This decline in donors’ ODA effort marks a
continuation of the steep fall since the mid-1980s, when total net ODA from DAC members
was 0.35 percent of aggregate GNP (figure 3.2).
Back to top
Back to Contents
DAC members provided $55 billion in official development
assistance to developing countries and multilateral development banks in 1996, down from
$59 billion in 1995, reflecting a decline of 4 percent in real terms.2 Driving this
decline was a $5 billion fall in aid from Japan, the largest donor. The sharp decline in
Japanese ODA in dollar terms stemmed from a 14 percent depreciation of the yen against the
dollar and a 25 percent drop in ODA in yen terms, as difficult economic conditions and
pressures for fiscal consolidation constrained Japan’s 1996 ODA budget to 1 trillion
yen, down from 1.4 trillion yen in 1995. Also contributing to the decline in Japanese ODA
were a delay in payments to the International Development Association (IDA) and other
multilateral institutions planned for 1996 due to protracted multilateral negotiations and
a rise in repayments of bilateral concessional loans to Japan. Austria, Canada, France,
and Portugal also registered significant falls in ODA. But 9 of the 21 DAC member
countries increased aid as a share of GNP. ODA flows from the United States rose by 21
percent in real terms in 1996, and those from Italy by 34 percent. In both cases the flows
included funds that had been approved but not spent in 1995.
The ranking of countries by their ratio of net ODA to GNP has
changed little over the past 10 years, however. Norway, the Netherlands, Denmark, and
Sweden continue to have the highest ratios. Among the major donors, Denmark has increased
its ODA ratio (from 0.9 percent in 1986 to more than 1 percent in 1996), France has
maintained a constant ratio, and the others have seen declines in their ODA ratios of
between 15 and 50 percent.
Prospects for ODA allocations are dismal. Preliminary information
for 1997 shows that net ODA flows could have declined to as low as 0.21 percent of DAC
countries’ GNP.3 In Europe continued efforts to meet the Maastricht target for fiscal
deficits (3 percent of GDP) will restrict the scope for real increases in ODA. In Japan,
the largest donor by volume, pressure to reduce the fiscal deficit led to a 10 percent cut
in the ODA budget for fiscal 1998, and further cuts are expected through 2000. In the
United States, which has halved the ratio of net ODA to GNP since the mid-1980s, opinion
polls show continued public concern over the funds devoted to foreign aid, in part because
of exaggerated perceptions of aid’s share in the budget (currently about 1 percent).4
Many donors are channeling an increasing share of their ODA flows
through nongovernmental organizations (NGOs). While in 1980 official sources accounted for
less than 10 percent of NGO budgets, by the 1990s their share had risen to 35 percent. But
the private resources that NGOs have channeled to developing countries have stagnated at
around $6 billion since the mid-1990s and are estimated to have declined to $5.7 billion
in 1997.
Aid effectiveness
There is increasing evidence that development assistance is most
effective when it supports sound economic policies. Experience over the past 20 years has
shown that development projects have little chance of success in an environment of high
inflation and severely distorted prices produced by inadequate policies.
In a recent study of World Bank–financed projects, the
Bank’s Operations Evaluation Department confirmed that the macroeconomic environment
plays a critical part in determining the success of borrowers’ project portfolios
(Piciotto 1997; World Bank 1997a). Another study by World Bank researchers provides strong
empirical support for the view that sound economic policies are vital to ensure effective
use of aid (Burnside and Dollar 1997). It found that large aid flows tend to be associated
with faster growth in countries with a sound policy environment—defined as an open
trade regime, fiscal discipline, and the absence of high inflation. And it found that aid
made little or no contribution to growth in countries with poor policies. In a sample of
41 low-income developing countries in 1970–93, countries with good policies that
received large amounts of aid achieved GDP per capita growth rates of 3.5 percent a year,
while countries with good policies and small amounts of aid had per capita growth rates of
2 percent. Countries with poor policies achieved virtually no per capita growth,
regardless of whether they received large or small amounts of aid.
Back to top
Back to Contents
Other studies have tended to confirm the importance of sound
economic policies for aid effectiveness (although their results are sometimes ambiguous).
Both Killick (1991) and Kreuger, Michalopoulos, and Ruttan (1989) argued that the
effectiveness of economic assistance is strongly affected by the economic policy
environment in recipient countries. Boone (1996) found that aid most directly assists the
poor (a different focus from Burnside and Dollar, who were more concerned with the impact
of aid on growth) in countries that have liberal political regimes and democracies.5
Has aid generally gone to countries with good policies? The
evidence is mixed. The literature finds that bilateral aid tends to be allocated more on
the basis of strategic considerations than does multilateral assistance. Burnisde and
Dollar found that in 1970–93 countries with poor policies received as much bilateral
aid relative to income as countries with good policies, reflecting the influence that
strategic and political factors have had on bilateral aid allocations. But they found that
the allocation of multilateral aid—including assistance from the World Bank’s
IDA—favored countries with good policies. Killick (1991), McKinlay and Little (1978),
Boone (1996), Kreuger, Michalopoulos, and Ruttan (1989), and Maizels and Nissanke (1984)
have also cited the importance of strategic considerations in bilateral aid allocation.
Studies have also provided some support for the view that
multilateral aid has been less responsive to strategic considerations. Maizels and
Nissanke (1984) found that the allocation of aid by multilateral donors in the late 1980s
(though not in the late 1960s) was based on countries’ needs. Trumbull and Wall
(1994) found that the needs of recipients played a significant part in the allocation of
ODA by multilaterals, although Frey and Schneider (1986) concluded that World Bank lending
was best explained by a combination of economic and political indicators rather than by
such considerations as need or development potential.
But these studies mostly explain the allocation of aid before the
1990s. The increasing recognition of the importance of the policy environment for aid
effectiveness has recently led donors to focus more attention on efforts to increase aid
to good performers. One such effort, the Special Program of Assistance for Africa, helps
coordinate aid efforts to ensure that African countries that are effectively implementing
economic reform programs receive the quick-disbursing assistance they need. The program
identifies funding gaps in performing countries and provides timely information on the
status of reform programs so that donors can adjust the allocation of assistance
accordingly. The program reflects donor countries’ commitment to improving the
effectiveness of aid through better coordination of aid delivery at the national and local
levels.
Donor countries also are working to coordinate the goals of aid.
The DAC has set out a strategic agenda of goals to be achieved in developing countries by
2015 with the support of official assistance. The agenda includes reducing by half the
proportion of people living in extreme poverty, ensuring universal primary education in
all countries, eliminating gender disparity in primary and secondary education, reducing
by two-thirds the mortality rates for infants and children under age five, reducing by
three-fourths maternal mortality, providing access to reproductive health services for all
individuals of appropriate age, and reversing the current trend in the loss of
environmental resources.
Has the increased attention to aid effectiveness and policy
performance led to any improvement in donors’ allocation of aid to good performers in
recent years? There is some evidence that it has. Between 1990 and 1995 the share of net
ODA going to the best-performing countries—the first and second quintiles in a
ranking of policy performance by the World Bank—rose from 38 percent to 45 percent
(table 3.2). Most of the change stemmed from a decline in the share of the fourth
quintile.
Table 3.2 Recipients’ share of
official development assistance by policy performance, 1990 and 1995
(percent)
|
All developing countries |
Low-income countries a/ |
| Performance quintile |
1990 |
1995 |
1990 |
1995 |
| 1st (best) |
20 |
23 |
16 |
22 |
| 2nd |
18 |
22 |
20 |
31 |
| 3rd |
15 |
25 |
33 |
15 |
| 4th |
34 |
14 |
18 |
15 |
| 5th (worst) |
13 |
15 |
13 |
16 |
|
|
|
|
|
| Total |
100 |
100 |
100 |
100 |
Note: The categorization by performance is based on World Bank ratings that
evaluate the effectiveness of economic policies in supporting growth and reducing poverty.
The ratings for each year are used, so the composition of each group differs between 1990
and 1995. a. Excluding China, India, and Pakistan, which also borrow from IBRD and other
nonconcessional sources of official development finance.
Source: OECD data and World Bank staff estimates.
Back to top
Back to Contents
Donors might use other allocation criteria to enhance the
development impact of aid that could lead to less observable improvement in aid allocation
by policy performance. For example, donors might allocate more aid to countries heavily
dependent on concessional flows than to those with access to nonconcessional flows, or
more aid to lower-income than to middle-income countries. But there does not appear to
have been any improvement in aid allocation by these criteria during the 1990s. The share
of net ODA going to countries with access to private flows (countries with bond ratings
from international credit rating agencies) was 33 percent in 1996, essentially the same as
it was in the mid-1980s. And the share of net ODA going to low-income countries has
declined in the 1990s, from 50 percent in 1991 to 46 percent in 1995. This decline
reflects a fall in the share of bilateral ODA to low-income countries (from 45 percent in
1991 to 28 percent in 1996), due in part to the fact that in many large recipients civil
war or economic or political conditions have precluded substantial official assistance.
The share of multilateral ODA to low-income countries has remained unchanged over the
decade, but it has shifted sharply toward humanitarian support (which averaged close to 20
percent in 1994–96).
Another way to determine whether concerns over income levels or
capital market access affect the data on aid allocation by policy performance is to look
at the allocation among low-income countries (see table 3.2).6 The best-performing 40
percent of these countries received 53 percent of ODA in 1995, up from 36 percent in 1990.
But this increase in ODA to the top two quintiles came at the expense of the third
quintile; the share allocated to the worst performers changed little. In short, aid
allocation did improve among low-income countries, but it is unclear whether it improved
more than among all developing countries. And there is inevitably a problem of
“adverse selection” in the allocation of some forms of aid. For example, the
significant share of aid provided primarily for emergency assistance and humanitarian
reasons will go disproportionately to countries where political or economic conditions may
not be conducive to good policies.
One area where progress has been made is in donor efforts to
increase the concessionality of aid and to minimize the use of ODA loans (as opposed to
grants), particularly for countries with an unsustainable debt burden. Several donors now
provide all their ODA in the form of grants, most provide all their ODA to heavily
indebted poor countries as grants, and many have canceled the ODA obligations of these
countries. As a result several donors (Australia, Norway, and the United Kingdom) no
longer have any outstanding ODA claims.
Yet the terms on ODA from some donors are hardening, owing to an
increase in the share of loans. Despite the fall in total net ODA, new commitments of
concessional loans from bilateral donors rose by 15 percent between 1995 and 1996. Because
of the lag in actual disbursements, however, this trend will not start to show up in net
ODA flows until 1997. The tendency to mix ODA and commercial loans in a single package
also appears to be increasing, reversing the trend of the early 1990s. Fully a third of
ODA lending committed in 1996 had associated commercial funds, underlining the continued
importance of tied aid and the influence of commercial interests on aid flows.
Progress
under the HIPC Debt Initiative
The Debt Initiative for Heavily Indebted Poor Countries (HIPCs)
was launched in September 1996 out of a recognition that despite considerable efforts by
countries and creditors, many of the poorest developing economies still faced
unsustainable debt burdens. This section explains that:
The HIPC Debt Initiative has played an important part in the
evolution of donor policies and in the increased effectiveness of aid by making the
achievement of debt sustainability its explicit goal and by involving all creditors in
debt relief efforts. In its first year seven countries that had established the required
track record of good economic performance were considered for additional debt relief under
the initiative, and agreements were reached to reduce the debt of four of these countries
by $1.2 billion in present value terms. The HIPC Debt Initiative is geared to encouraging
improved economic and social policies, facilitating the provision of interim finance to
strong performers, contributing to a more productive relationship between creditors and
debtors, and, ultimately, enabling countries to exit from repeated debt rescheduling
exercises.
The HIPC Debt Initiative was formed against a background of weak
economic performance and high debt levels in a large number of poor countries. Economic
reform programs undertaken by many of these countries have improved economic performance.
And debt relief efforts—through such mechanisms as the Paris Club, the IDA Debt
Reduction Facility, and the World Bank’s Fifth Dimension Program—have provided
substantial benefits. But for many countries the debt relief available through these
mechanisms could not ensure that debt sustainability could be achieved within a reasonable
period even with good policy performance.
Back to top
Back to Contents
Economic performance and debt of the HIPCs
Forty-one countries are classified as heavily indebted poor
countries.7/ Mostly in Africa, these countries account for 12 percent of the debt of
developing countries, but less than 5 percent of their exports and only 3 percent of their
GNP (table 3.3). Though economic and policy performance has varied widely among the HIPCs,
average GDP growth for the group was only 2.2 percent between 1985 and 1990. The GDP
growth rate fell to 1 percent during 1990–95, well below the population growth rate
of 2.7 percent. The volume of exports from HIPCs rose by 2.7 percent a year in
1985–90, but the increase slowed to 2.2 percent in 1990–95 despite more vigorous
reform efforts (table 3.4). The HIPCs’ poor average growth can be attributed in large
part to civil disturbances, weak governance, unstable macroeconomic policies, and severely
distorted prices in many of the countries and to declining terms of trade during the late
1980s in some. Large debt burdens also have played a part in depressing investment and
growth.8/
Table 3.3 Heavily indebted poor countries
relative to all developing countries, 1996
(percent)
Region |
|
Number of
countries |
Share of
population a/ |
Share of
external debt |
Share of
GNP |
Share of
exports |
| Africa |
|
33 |
10.6 |
8.8 |
2.3 |
3.3 |
| Asia |
|
4 |
2.8 |
1.9 |
0.8 |
1.0 |
| Latin America |
|
4 |
0.4 |
0.8 |
0.2 |
0.3 |
| Total |
|
41 |
13.8 |
11.5 |
3.3 |
4.7 |
a. Data are for 1995.
Source: World Bank data.
Table 3.4 Economic performance of the
heavily indebted poor countries, 1980–95
(average annual percentage change or percent)
| Indicator |
|
1980–85 |
1985–90 |
1990–95 |
| Export growth |
|
–0.8 |
2.7 |
2.2 |
| GDP growth |
|
1.3 |
2.2 |
1.0 |
|
|
1985 |
1990 |
1995 |
| Debt/exports |
|
383 |
506 |
465 |
| Debt service/exports |
|
26.2 |
22.1 |
22.6 |
| Net transfers/GDP a/ |
|
8.2 |
10.4 |
9.1 |
a. Net transfers from official sources.
Source: World Bank data.
The median ratio of the present value of debt to exports among
HIPCs is 340 percent, and some have ratios of more than 1,000 percent (the average ratio
of debt to exports for other developing countries is 130 percent). Debt burdens of this
size raise concern that debt may not be sustainable, meaning that the debtor is unlikely
to be able to service the debt and, ultimately, to repay it without resorting to further
rescheduling or the accumulation of arrears (box 3.1).
| Box 3.1 What are sustainable debt levels?
The concept of sustainable debt levels is critical for understanding the position of
the HIPCs and the goals of the HIPC Debt Initiative. Sustainability can be defined as
meaning that “a country is able in all likelihood to meet its current and future
external obligations in full without resorting to rescheduling in the future or
accumulation of arrears” (Claessens and others 1996). For debt from private sources,
a set of policies (and the resulting debt level) is sustainable if the projected path of
key macroeconomic targets is consistent with the level of financing likely to be
forthcoming on a voluntary basis. In the long run new lending (at positive real interest
rates) cannot finance the full amount of interest payments due (see Cuddington 1997). This
condition is met only if debt grows more slowly than the interest rate. Defining the
sustainability of debt from public sources is more difficult, since the conditions under
which voluntary finance is likely to be forthcoming from official sources are less clear
than for private sources. One approach is to define sustainability as the country’s
ability to achieve, over a defined period, equilibrium in the balance of payments, and to
reach a level of debt by the end of the period that is low enough to make future debt
service problems unlikely (Claessens and others 1996, p. 9). |
Continue with The changing role of official finance
Back to top
Back to Contents |